Documentation
How to use our tool?
Sign up & Sign in
The Binary Visualization Projoct is a work under DETER . Please apply an user account there first.
Creating a Project
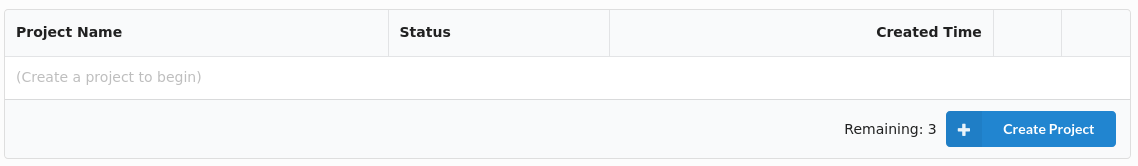
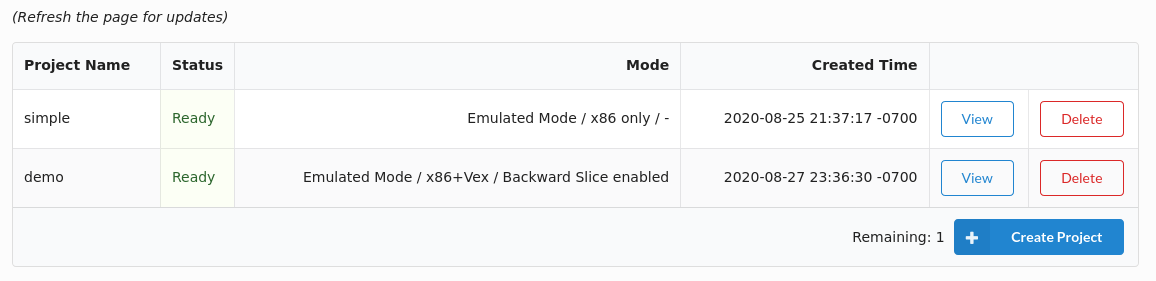
Go to your Project main page and create a new project!
By default you can have 3 projects created at same time. Please contact us if you feel like you need more.
You can choose to get just the x86_64 instuctions, or also angr's intermediate representation - Vex for your binary file.
The Backward Slice Analysisoption enables data dependency analysis. This feature can only be accessed if you've set the Vex option on.
We create the views based on angr CFG. There are two modes you can choose from:
Fast Mode: Generate function-call graph and control-flow graph based on angr CFGFast(). This mode creates the views very fast. But it may be slightly incorrect because CFGFast uses static analysis, and some control-flow transitions can only be resolved at execution-time.Emulated Mode: Use angr CFGEmulated() instead to generate control-flow graphs. Theorectically, this provides a more accurate result. However, it takes significantly more time to compute, and the emulating process may have a few issues for some binary files.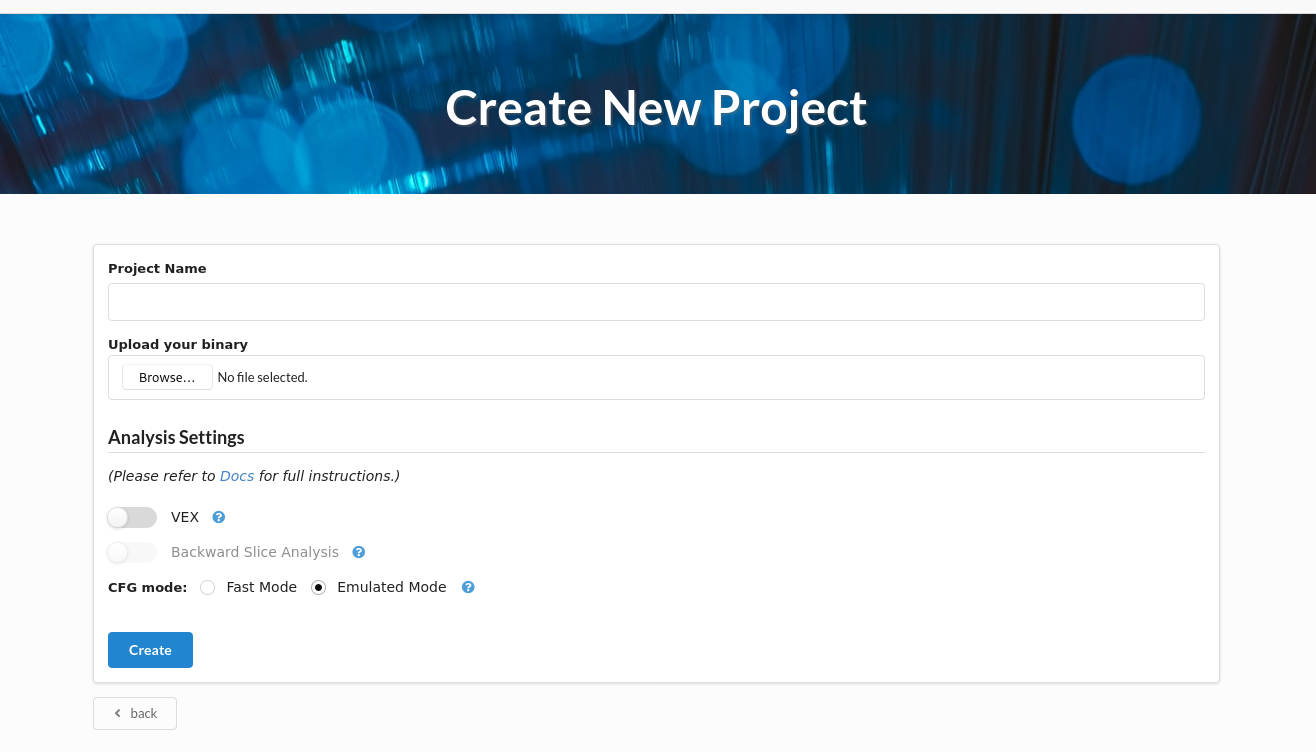
The Visualization Interface
Once we finish the anlysis successfully, you can click on the 'view' button to see what we extracted from your binary file.
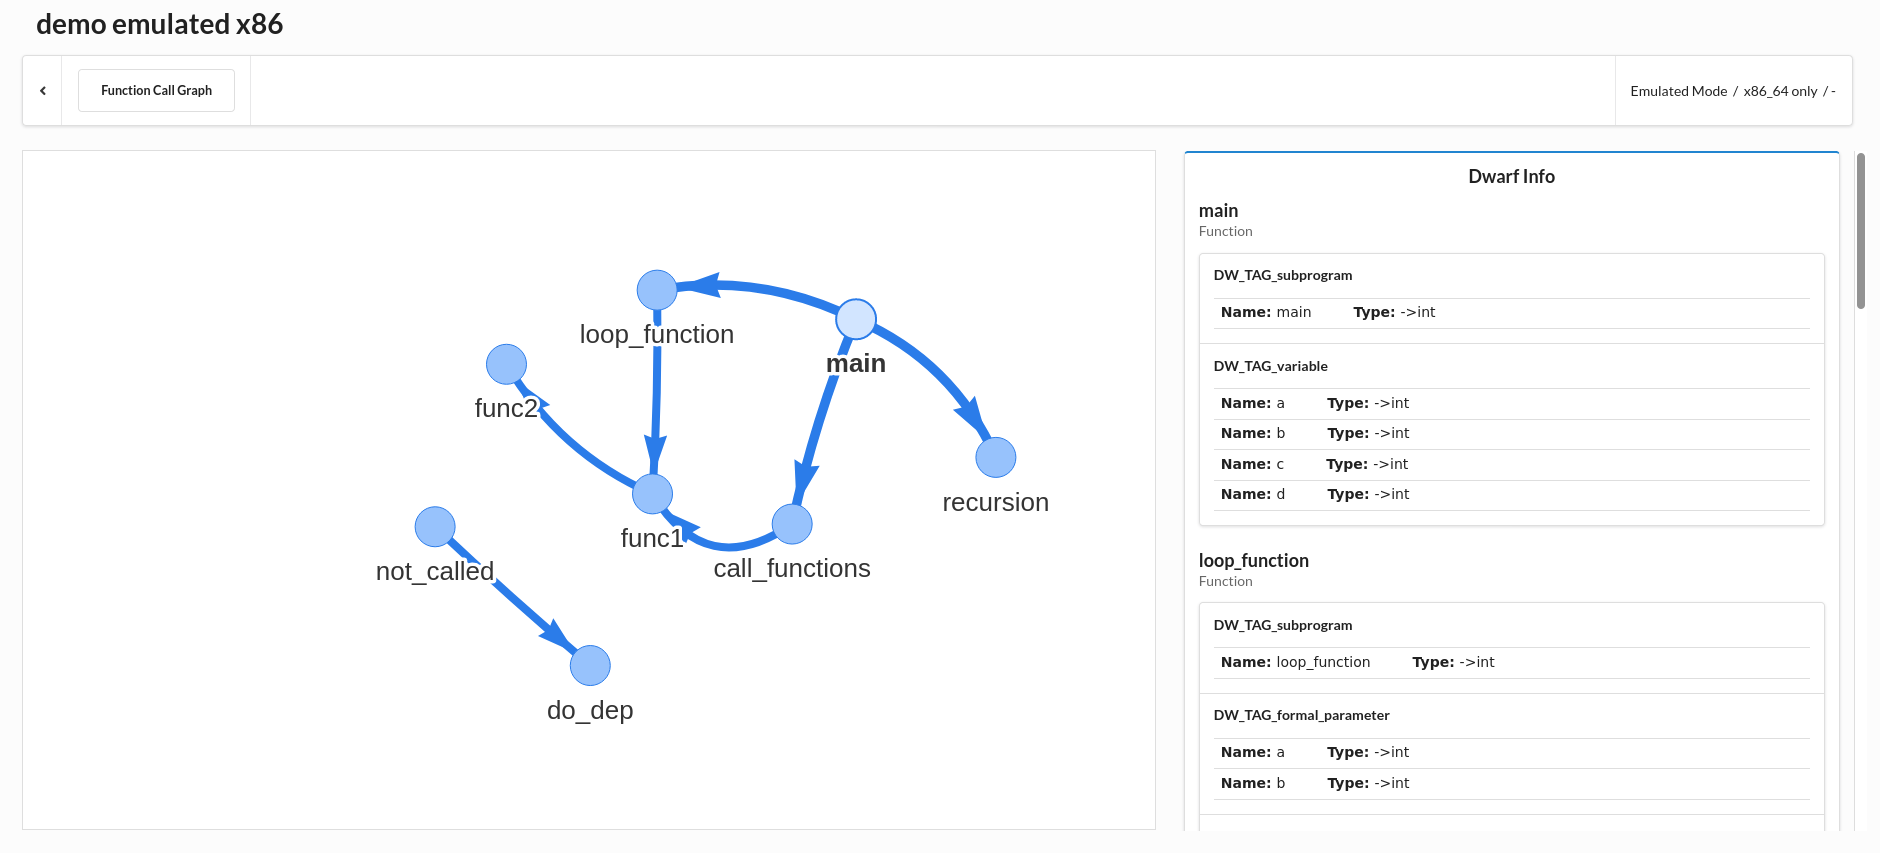
First, you will see the function call-graph. If you uploaded a file with debug symbol, we will try to extract DWARF Debug Symbols and list them on the right hand side.
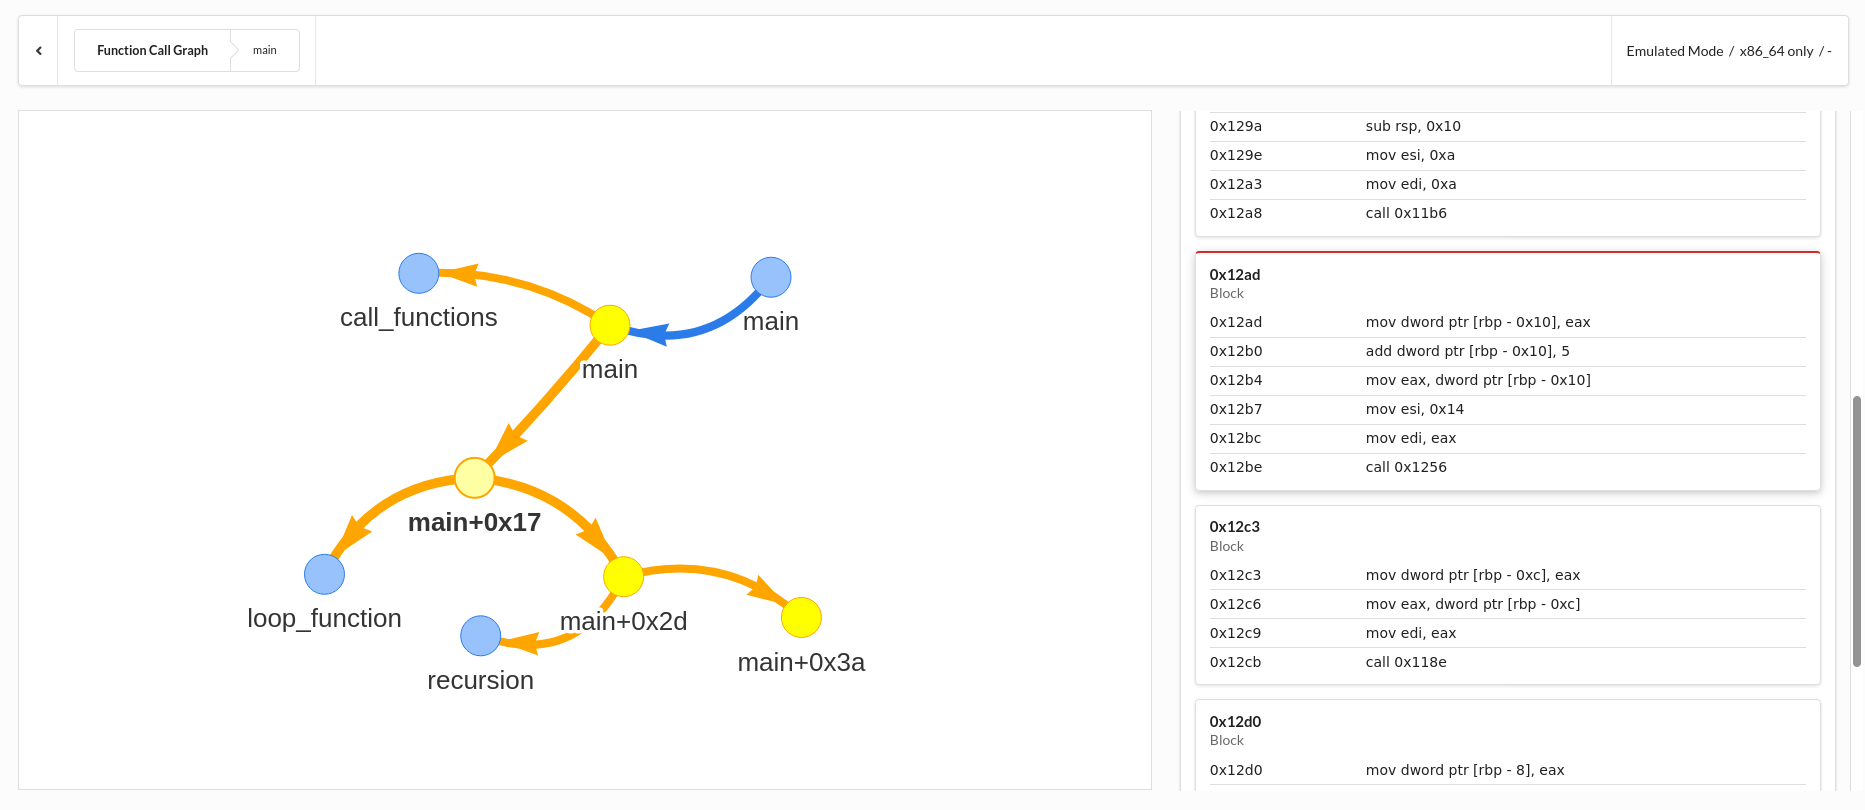
Click on any of the function nodes, you will enter the function and see its control-flow graph. Each node is a basic block.
When you click on the basic blocks on the left hand side, the list on the right hand side will scroll to the corresponding address.
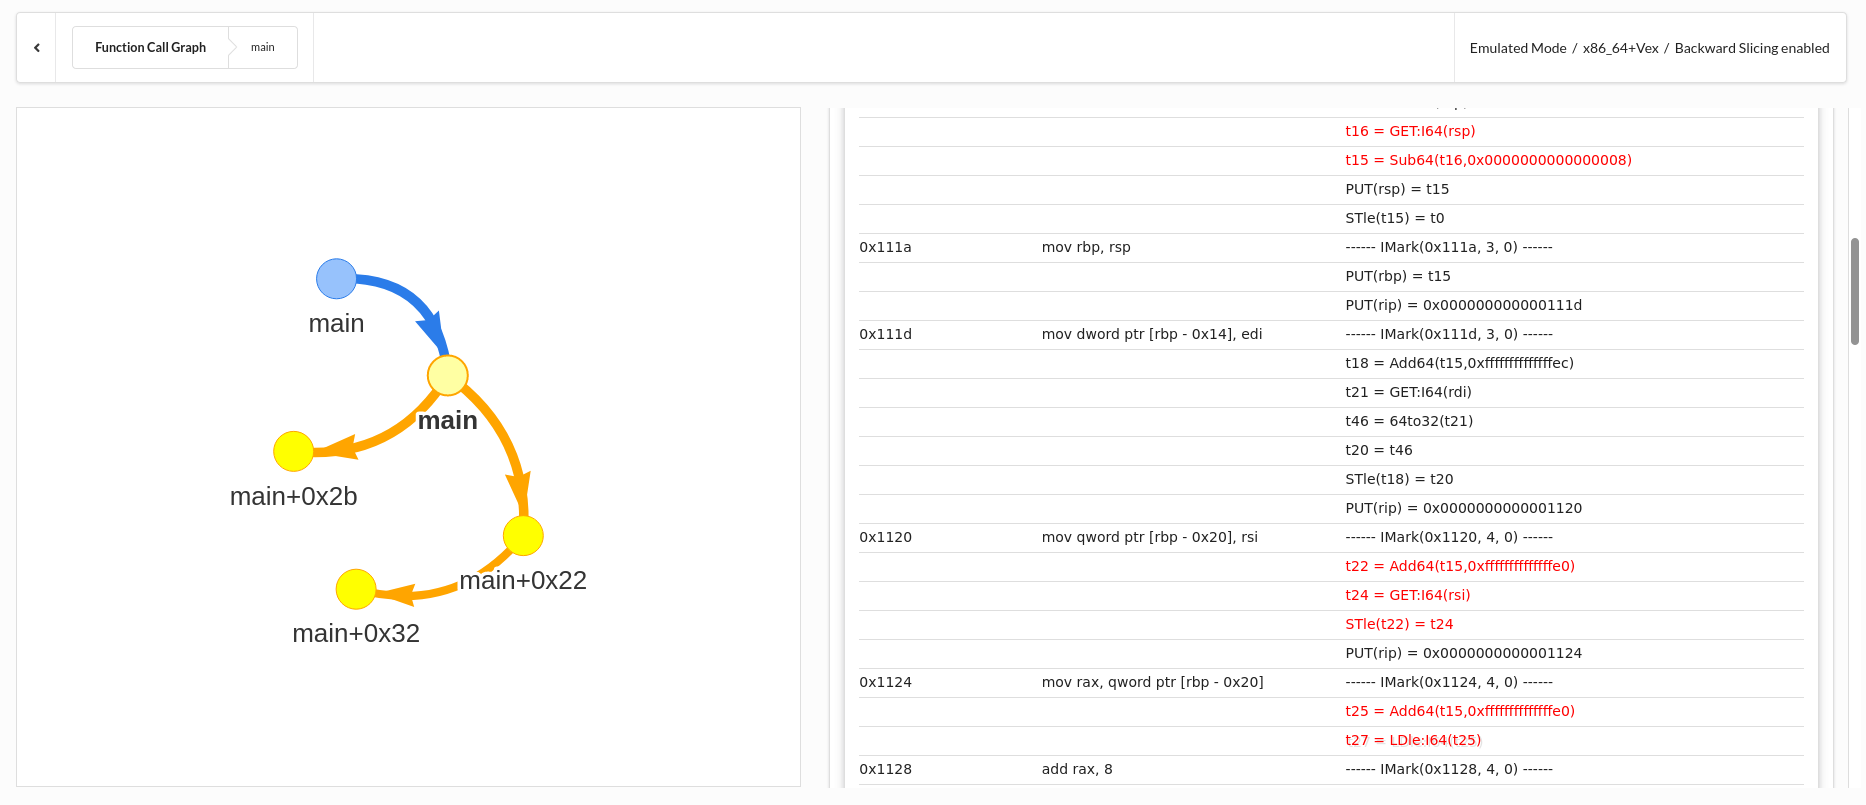
If you enable the Backward Slice Analysis option, you can click on the Vex instructions and see their data dependent instructions.
Troubleshooting
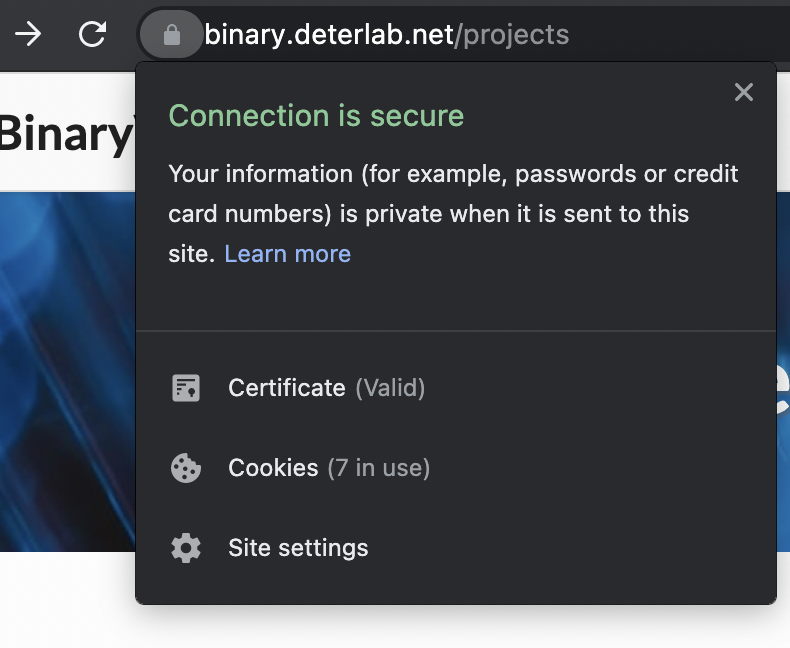
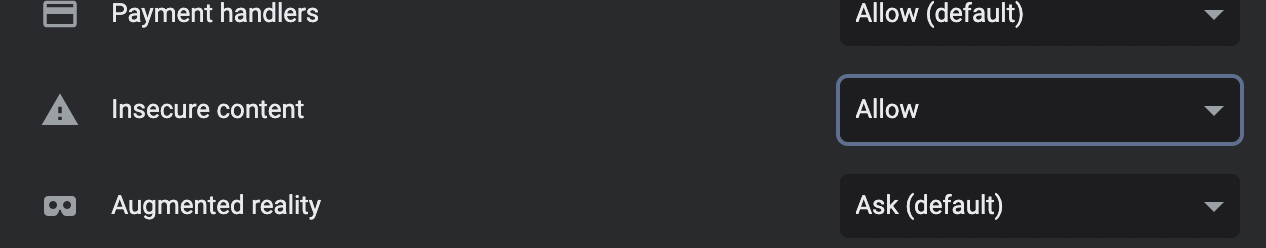
Blank Interface
If your visualization interface is not displaying any content, try the following steps:
Firefox
Chrome